
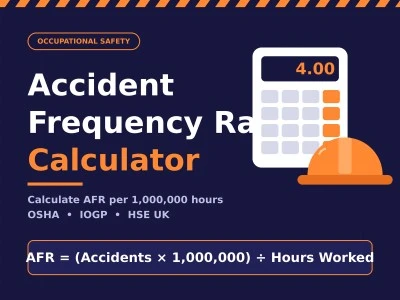
Accident Frequency Rate Calculator
Introduction / About the Calculator
After years of managing site audits, I trust the Accident Frequency Rate Calculator more than gut feeling. Every AFR turns scattered workplace accidents into one comparable figure, and that quantitative approach anchors occupational safety conversations.
Here is the surprise: the International Accident Frequency Rate works because hours worked sit in the denominator. A 1,000,000-hour base or 1,000,000 hours scale keeps small crews and giants honest, whichever financial year you report.
Regulators care too. HSE UK, OSHA TRIR and IOGP members each set a different scope, so an appropriate formula matters. Commonwealth countries lean toward mandatory reporting, while a specified number of hours keeps everything convertible.
Accident Frequency Rate Formula
Start with the arithmetic: Number of Accidents multiplied by 1,000,000, divided by Total Number of Hours Worked. Many companies in operations heavy sectors prefer that yardstick because it delivers one clean standardized scale for comparison.
OSHA thinking differs. Its 200,000 hours (OSHA style) base equals 100 employees working 40 hours per week across 50 weeks per year, and results appear as accidents per 100 employees from the OSHA 300 log.
Alternative bases exist: 100,000 hours (alternative) suits HSE UK style reporting, while IOGP keeps a million. Always standardise every hours base, store data in spreadsheets or files, and cite regulation to defend the metric properly.
How to Use the Calculator
Safety managers and organization leaders rarely have time for maths, which is why a calculator that simplifies complex calculations matters. Count accidents first, then Enter hours for the period under review, without any real guesswork.
Type the number of accidents into the Reportable accidents field, add Total hours worked and employees, and choose the Formula type: per 1,000,000 hours (Standard), per 200,000 hours (OSHA style) or per 100,000 hours (Alternative).
Press the Calculate button and Read AFR immediately; the Accident Frequency Rate appears quickly. Use it to assess safety performance across your accounting period, then compare it against last quarter without ever opening another spreadsheet.
Accident Frequency Rate Calculation Examples
Take a manufacturing company with 6 accidents and 1,500,000 hours across 12 months: (6 / 1,500,000) × 1,000,000 gives 4.0, expressed as AFR per million hours. Divide by five for the Equivalent OSHA figure, roughly.
Another site logged 4 recorded accidents over 115,000 hours. On the 200k base, that is 6.95 accidents per 100 employees, which looks relatively high for its industry, beside ISO 45001 targets from the previous year.
Five accidents across 2,000,000 hours, (5 × 1,000,000) ÷ 2,000,000, yield 2.50, meaning 2.5 per 1,000,000 hours, or 0.50 on the US standard. The ILO and any international standard accept either when bases are stated.
Interpreting the Results
A lower rate is not automatically good news, and a higher rate is not automatically a failure. I judge every outcome against industry standards, depending on the industry, before deciding whether the results deserve celebration.
When the AFR Calculator shows 6.95 accidents per 100 employees, that signals a greater frequency of accidents. Treat it as relatively high, investigate safety issues, match improvement strategies to better safety practices and safety goals.
Use the benchmark as a compass, not a verdict. Organizations comparing performance on accidents per 200,000 hours worked should always ask what happened beyond the numbers, including near misses, reporting culture and honest management attitude.
AFR vs LTIFR vs TRIR (Difference Between Metrics)
TRIR stands for Total Recordable Incident Rate, and it counts OSHA recordable incidents including medical treatment cases. That broader range of incidents is exactly why it cannot be swapped casually with AFR in board reports.
LTIFR, the Lost Time Injury Frequency Rate, only tracks lost-time injuries involving time away from work. Reported per million hours worked on a 1M basis, it uses different bases than TRIR’s 200k, giving different scopes.
Check whichever regulator governs your region or organization, because the definition of accident varies. Then state specified hours worked, the 200,000 hours base, and exactly how accidents were counted before comparing any Accident Frequency Rate.
Conclusion
The Accident Frequency Rate Calculator earns its place as a pivotal tool because it becomes a standardized measure of accident frequency. Used honestly, it exposes areas for improvement long before any external audit ever does.
Real workplace safety grows from culture of safety habits that people actually practise: enhancing reporting, aligning best practices with daily work, and helping organizations build safer workplaces and more efficient workplaces together, every single year.
Frequently Asked Questions
What Is the Difference Between AFR and TRIR (or LTIFR)?
AFR usually scales to a 1M hour base, whereas TRIR works from 200k. Those different bases mean numbers cannot be compared directly without converting, which is the mistake I see most often in site audits.
LTIFR only counts injuries causing lost days, while OSHA-defined recordables cast a wider net. Ask your regulator which applies, because different scopes decide what counts, and nobody really wants a nasty surprise during inspection week.
What Constitutes an Accident in AFR?
The definition of accident is not universal. Some treat only injury or illness as qualifying, while others include property damage, so workplace incidents can be counted very differently between two neighbouring sites of one organization.
Your region matters as well. Local regulations and specific definitions written into internal policy decide what enters the AFR, so document them once and apply the same rule every reporting cycle without a single exception.
Which AFR Formula Should I Use?
For international standards and benchmarking, I default to 1,000,000 hours. It is the safest AFR formula when your data will travel beyond your own borders, customers, or contractors, especially across large multinational project supply chains.
Choose OSHA-style calculations with 200,000 hours when American regulators are involved, or 100,000 hours when local practice demands it. Always check your organization’s specific requirements first, then stay consistent across every single report you publish.
How Does AFR Differ From Incident Rates?
In my experience, incident rates cast a much wider net than AFR. They may include near misses, illnesses and property damage, whereas accidents in an AFR count are usually confined to events that caused harm.
Injuries remain the common thread. Still, an AFR built only on injuries tells one story, while incident rates tell another, so I track both side by side and never let one metric replace the other.
What Is a Good AFR Rate?
A good AFR depends on where you work. Construction, mining and offices differ, so the rate varies significantly by industry, and quoting industry benchmarks without context routinely misleads far more people than it usefully informs.
Forget absolute numbers; direction matters more. Steady continuous improvement, quarter after quarter, beats one impressive figure, and a rising line deserves questions long before a low line deserves applause from the board, staff or auditors.
Ways of Calculating AFR (Tools Used)
AFR is easy to calculate, thanks to a straightforward formula. Most companies still simply pick from several mediums, and every option carries its own pros and cons depending on team size, reporting frequency and budget.
Physical calculators and Excel spreadsheets handle crunching numbers cheaply. Online calculators save time, while dedicated safety software offers tracking and analysing features, with results tracked against historic numbers for additional context that leadership really values.
Weigh costs against investment honestly. A free sheet is fine for a small team, but if figures must stay updated across sites, dedicated tools repay their price quickly, sometimes even within a single financial year.
Ways to Make Your AFR Calculation More Accurate and Reliable
Only two variables drive the AFR number: reported accidents and total numbers of hours worked. Errors in either quietly skew the final result, so I check both before sharing anything with authorities or handling insurances.
Small projects and a small company are vulnerable, because one case swings the indicator of safety performance. Use a year’s worth of collected data, document every count, and let auditors trace accurate, reliable figures efficiently.
Watch for red flags during safety meetings, audits and process changes. Whether external factors or internal reasons moved the final number, share safety information so informed decisions can improve and lowering AFR number becomes success.
Who Uses This Calculator
Commonwealth OSH regulators rely on it during inspections, and UK HSE reporting teams use it to frame annual submissions. Many regulators simply want a repeatable rate they can compare across employers of every possible size.
IOGP members report using HSE and OSH style frameworks, while the UK industry, contractors and safety consultants adopt the same calculator to speak a shared language during tender reviews and routine annual client prequalification checks.
Understanding Key Workplace Safety Metrics (Reference Table)
These essential safety metrics share one skeleton: Name, Acronym, Definition and Formula. AFR uses Number of Accidents over Total Hours Worked, scaled to 1,000,000, while TRIFR and LTIFR follow similar logic with slightly different filters.
Total Recordable Injury Frequency Rate and Lost Time Injury Frequency Rate differ through Number of Lost Time Cases. Total Case Incident Rate, or TCIR, uses Number of OSHA Recordable Cases per 200,000 hours worked annually.
DART tracks Number of DART Cases involving restricted days, transferred days or restricted duty cases, per 100 full-time employees. Lost Workday Rate, LWDR, and SR weigh Number of Lost Workdays instead, revealing severity behind frequency.